Fibonacci retracement is one of those trading concepts that almost everyone has heard of, but far fewer people use with real consistency. The idea is simple: markets often trend, then pull back, then continue. Fibonacci levels aim to highlight the most common “pullback zones” where price may pause, react, or reverse before the trend resumes.
What makes Fibonacci especially useful is not that it predicts the future with certainty, but that it gives you a structured framework for planning trades: where a pullback might stall, where confirmation matters most, and where realistic profit targets could be placed if continuation happens.
The problem is that many traders either (1) draw Fibonacci on random swings, (2) rely on a single level without context, or (3) waste time recalculating levels manually when they’re trying to make fast, disciplined decisions.
This guide fixes those issues. You’ll learn what the key Fibonacci levels mean, how to choose swing points correctly, how to interpret retracements and extensions in real market conditions, and how to build practical entry/exit plans around them. You’ll also see how using a dedicated Fibonacci calculator can speed up the process while keeping the levels accurate.
If you want to compute retracement and extension levels instantly for a wide list of instruments (major/minor/exotic pairs and commodities), you can use the Fibonacci Calculator here:
https://www.calcpips.com/en/eur-usd/fibonacci-calculator
What Fibonacci Retracement Levels Actually Represent
A Fibonacci retracement is a measurement of how much of a prior move has been “given back” during a pullback.
If price moves from a swing low to a swing high (an up-move), a retracement asks: how far might price pull back before buyers step in again?
If price moves from a swing high to a swing low (a down-move), a retracement asks: how far might price bounce (pull back upward) before sellers step in again?
The most commonly used retracement levels are:
- 23.6%
- 38.2%
- 50%
- 61.8%
- 78.6%
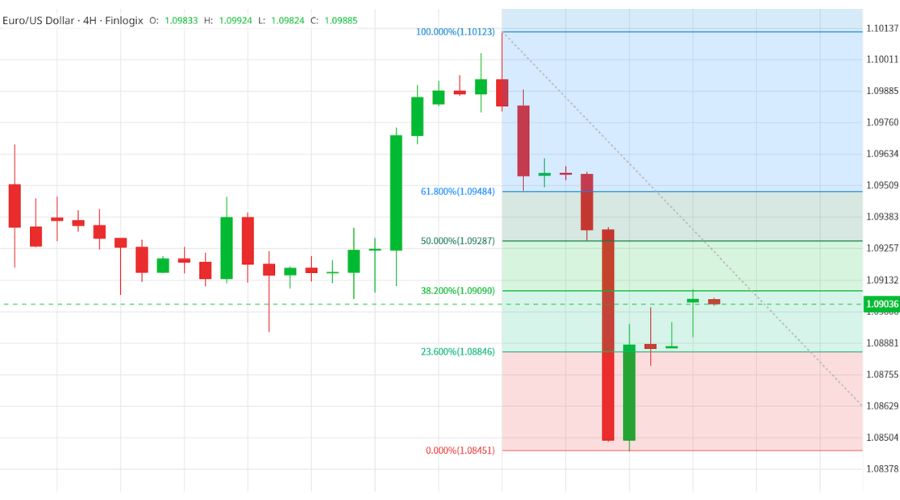
Most traders pay the closest attention to 38.2% and 61.8%, because these zones often become decision points: either the trend resumes, or the pullback deepens and the structure changes. The calculator on PipCalcs explicitly highlights these key retracement levels and explains the “golden ratio” significance of 61.8%.
Retracements vs Extensions
Retracements help you estimate where a pullback might end inside the original move.
Extensions project where price might go beyond the original swing if the trend continues. Common extension targets include:
- 127.2%
- 161.8%
- 261.8%
Your Fibonacci plan becomes much more useful when you combine both:
- Retracement levels for structured entries
- Extension levels for structured targets
The PipCalcs Fibonacci Calculator includes these extension levels as part of its output so you can plan targets without switching tools or doing extra math.
The Most Important Step: Choosing the Right Swing High and Swing Low
The accuracy of Fibonacci levels depends heavily on the swing points you choose. The math is always correct, but the market relevance is determined by whether your swing points represent a real move that other traders see.
Here’s a practical way to choose swing points:
In an uptrend
- Identify the most recent clear impulse leg upward (a move that broke structure or pushed to a new high).
- Set the low at the start of that impulse.
- Set the high at the end of that impulse.
In a downtrend
- Identify the most recent clear impulse leg downward (a move that broke support or pushed to a new low).
- Set the high at the start of that impulse.
- Set the low at the end of that impulse.
This is why “Trend Direction” is a key input on the PipCalcs pair-level calculator pages: the same prices will produce different level placement depending on whether you’re measuring an up-move retracement or a down-move retracement.
A Quick Way to Calculate Levels Without Guesswork
Manual calculation is possible, but it’s slow and error-prone when you’re doing it repeatedly.
A dedicated tool makes the workflow cleaner: enter swing high and swing low, select the trend direction, then the tool outputs all key levels instantly. That’s exactly the input flow shown on the PipCalcs Fibonacci Calculator pages (Trend Direction, High Price, Low Price, then Calculate).
For a fast start across many instruments (including commodities), you can begin from the main Fibonacci Calculator page, select the instrument, then compute levels:
https://www.pipcalcs.com/en/tool/fibonacci-calculator
Understanding What Each Level Tends to Mean
Fibonacci works best when you treat levels as zones and look for confirmation. Still, each level has a “personality” in how it behaves.
23.6% (shallow pullback)
- Often appears in strong trends with high momentum
- If price only retraces 23.6%, it suggests buyers/sellers are aggressive and not waiting for deeper discounts
38.2% (common continuation zone)
- Very common in healthy trends
- Often acts as the “first real test” of a pullback
- Especially relevant when it aligns with a prior support/resistance or a moving average
50% (psychological midpoint)
- Not a Fibonacci ratio from the sequence, but widely used in trading
- Represents “half of the move” and often becomes a decision zone
61.8% (golden ratio zone)
- Frequently the most respected level in many markets
- If price holds 61.8% and resumes, continuation setups often look clean
- If price breaks through and fails to reclaim, the pullback may be turning into a reversal
78.6% (deep retracement)
- Sometimes used for “last chance” continuation entries
- Also a warning: if price retraces this deeply, trend strength is likely weaker
The PipCalcs tool description explicitly lists these retracement levels as the key Fibonacci levels it generates and highlights the importance of 61.8%.
A Verified Example (Why Seeing the Math Helps)
One reason many Fibonacci users lose confidence is that they don’t understand what their platform is calculating. PipCalcs includes a “Verified Example” section on at least some pair pages that shows the math.
For example on EUR/USD, it demonstrates:
- Price range = High − Low
- Then computes levels like 38.2% and 61.8% by multiplying the range by 0.382 or 0.618 and subtracting from the high in a downtrend example
Even if you never do the math manually again, understanding the logic helps you trust the levels and spot input mistakes.
How to Build Trade Plans Using Fibonacci (Not Just Draw Lines)
Fibonacci becomes powerful when you turn it into a repeatable plan. Here are three practical approaches.
Strategy 1: Trend Continuation Entries on Retracement + Confirmation
- Identify a trend (higher highs/higher lows in an uptrend, or the opposite in a downtrend).
- Measure the most recent impulse swing with Fibonacci.
- Mark the 38.2%, 50%, and 61.8% zones as your primary “reaction areas.”
- Wait for price to reach one of these zones.
- Look for confirmation:
- Rejection wick(s)
- Engulfing candle in the trend direction
- Break of a minor counter-trend line
- Return of volume or momentum
Entry idea:
- Enter on confirmation at the zone
- Place invalidation beyond the next deeper level (or beyond the swing point for a wider stop)
This prevents the common mistake of “buying just because price touched a Fibonacci level.”
Strategy 2: Confluence Zones (Where Fibonacci Becomes More Reliable)
A Fibonacci level is most meaningful when it overlaps with other market structure.
High-quality confluence examples:
- 38.2% retracement aligns with an old resistance that should become support
- 61.8% retracement aligns with a rising trendline
- 50% retracement aligns with a major moving average
- Multiple timeframe alignment (a 61.8% on the 4H aligns with a 38.2% on the daily)
The key principle is simple: the more reasons a zone matters, the more likely other traders are watching it, and the more likely price reacts.
Strategy 3: Targets with Extensions (Structured Exits)
Once you enter on a retracement and price resumes the trend, extension levels help you avoid random exits.
Common target framework:
- First partial take-profit near 127.2%
- Second take-profit near 161.8%
- Stretch target (or trailing stop) if trend remains strong, potentially toward 261.8%
The PipCalcs calculator description explicitly includes these extension levels (127.2%, 161.8%, 261.8%) as projected target areas beyond the original move.
Risk Management: The Part Fibonacci Doesn’t Do For You
Fibonacci identifies zones, but it does not manage risk. Two traders can use the same levels and get opposite results depending on how they size trades and place stops.
A practical Fibonacci risk checklist:
- Define invalidation first (where your idea is proven wrong)
- Size position based on invalidation distance, not based on hope
- Avoid placing stops exactly on a Fibonacci line (too obvious); consider using structure-based invalidation
- Don’t treat every retracement touch as a trade; pick the best confluence setups
Common Fibonacci Mistakes (And How to Avoid Them)
Mistake 1: Using tiny swings
If you draw Fibonacci on every small move, levels will appear everywhere and lose meaning. Use clear impulse legs.
Mistake 2: Ignoring direction
If you choose the wrong direction (uptrend vs downtrend), the levels will be placed incorrectly. Tools that include a “Trend Direction” input make this explicit so you don’t forget it.
Mistake 3: Treating levels as exact prices
Markets rarely reverse at the exact decimal. Think zones and confirmation.
Mistake 4: No plan for exits
Many traders focus on entries only. Use extensions or structure-based targets to define exits.
A Simple “Fibonacci Workflow” You Can Repeat Daily
Here is a repeatable process that keeps Fibonacci practical:
- Identify trend and the latest impulse swing
- Mark swing high/low
- Compute retracement + extension levels
- Map confluence zones (structure, trendline, moving average)
- Wait for price to reach the zone
- Require confirmation
- Execute with defined invalidation and defined targets
- Review results and refine swing selection
If you want the fastest implementation, compute the levels in seconds using the PipCalcs Fibonacci Calculator, then focus your time on context and confirmation rather than manual math.
Final Thoughts
Fibonacci is not magic, and it doesn’t need to be. Its real value is that it forces structure onto a chaotic environment: you identify a meaningful move, measure it consistently, and plan around the most common reaction zones and continuation targets.
Used properly, Fibonacci retracement helps you:
- Stop chasing entries
- Define pullback areas objectively
- Align trades with structure and confirmation
- Plan exits with extension targets instead of emotion
And when you remove the friction of manual calculation, you’re more likely to apply Fibonacci consistently. That consistency is what turns a tool into an edge.


